
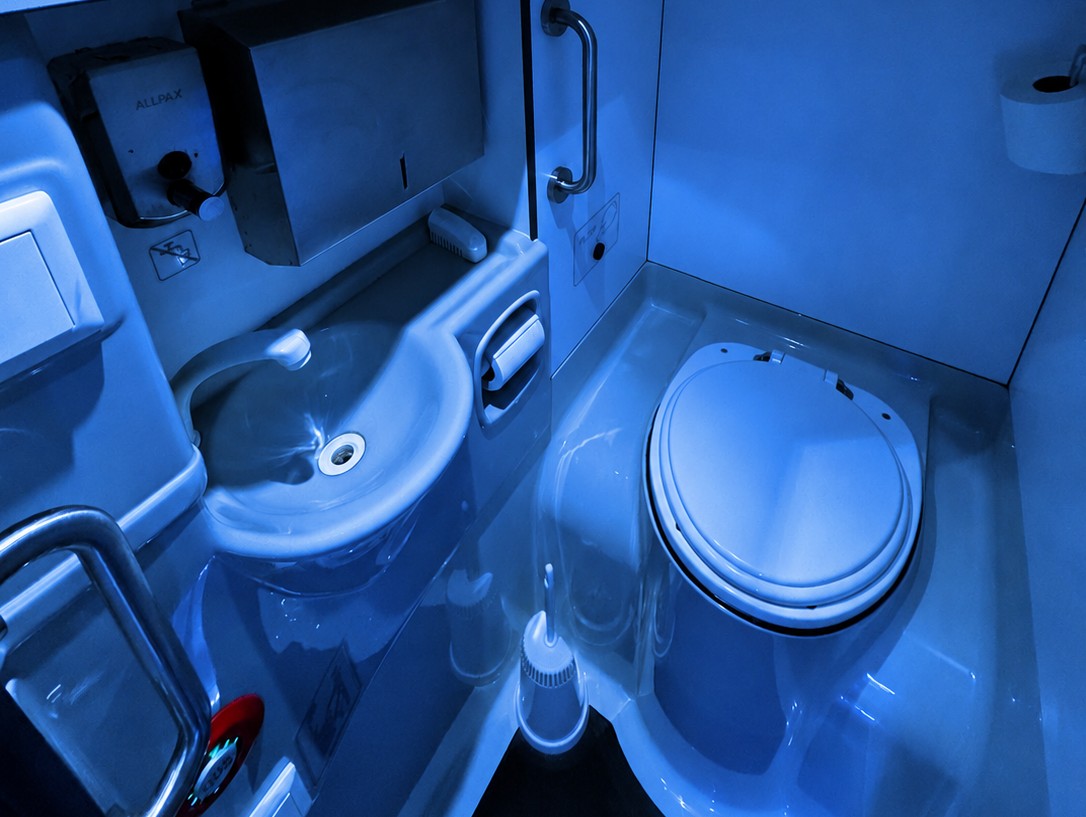
How clean is a professionally cleaned bus restroom, in reality? Where are the areas of a bus restroom that are critical for hygiene ?
A field test conducted at a major tour operator in Switzerland demonstrates why hygiene validation should go beyond the supposedly obvious contact surfaces and what additional benefits the use of automated disinfection can provide.
Test process
Public restrooms are small, heavily used spaces with numerous contact surfaces. Even if they are professionally cleaned on a regular basis, an important question arises: Do the surfaces on which cleaning and hygiene checks focus actually correspond to the areas with the highest microbial contamination?
A field test conducted in the restroom of a tour bus sought to answer this question. At the same time, the study examined what changes could be observed when the existing professional cleaning routine was supplemented with automated Spectral Blue bluelight disinfection.
The same bus restroom was deliberately examined throughout the entire test. This made it possible to avoid differences between various vehicles, construction methods, and cleaning procedures and to evaluate the two test phases under conditions that were as comparable as possible to real-world conditions. Since the effect of the blue light depends on the duration of exposure or the light dose administered, the results were observed over an extended period of time.
Key Findings at a Glance
- A total of 108 contact samples were collected from six specified surfaces.
- 72 samples were collected to assess the initial condition following regular professional cleaning.
- An additional 36 samples were collected after supplementary blue-light disinfection.
- Contamination was not evenly distributed across the surfaces examined.
- Particularly high levels were found at the front edge of the sink and on the shelf next to the sink.
- After the additional blue-light disinfection, the mean CFU value across all sampling sites was 60.8% lower than the baseline value.
- Five of the six sampling sites examined showed lower mean values in the post-treatment phase.
- None of the 36 post-treatment samples was rated as “needing improvement” or “insufficient hygiene.”
Initial Situation
The bus restroom under investigation was regularly and professionally cleaned after each use. The goal of the field test was not to question the overall quality of this cleaning. Rather, the aim was to examine how the remaining microbial surface contamination is distributed under real-world operating conditions.
The focus was on a practical question: Are the areas that are typically perceived as particularly critical actually always the ones with the most striking measurement values?
Test Setup
The samples were collected at six predetermined locations:
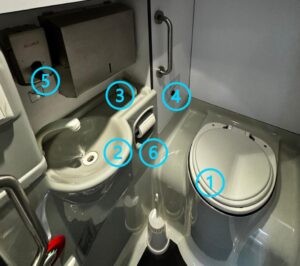
- Toilet seat
- Front edge of the sink
- Shelf to the right of the sink
- Flush button
- Soap dispenser push button
- Area under the toilet paper roll
In the first phase, twelve contact swab samples were collected at each sampling site following the regular cleaning routine. This resulted in 72 samples available for the baseline assessment.
In the second phase, the existing cleaning routine was supplemented with automated Spectral Blue blue-light disinfection. Subsequently, six additional contact swab samples were collected at each sampling site, for a total of 36 “after” samples.
The samples were incubated at room temperature and evaluated based on visible microbial growth.
Unexpected distribution of contamination
The assessment revealed a generally good level of hygiene, with a few notable exceptions. At the same time, it became clear that the microbial load was not evenly distributed across the surfaces examined.
Among the areas with the highest average count values were:
- Front edge of the sink
- Shelf to the right of the sink
- Toilet seat
This means that elevated readings did not occur exclusively in areas that are intuitively considered particularly critical. In fact, the surface next to the sink may easily receive less attention in daily hygiene practices than the toilet area or the flush button.
The test therefore highlights how important it is to verify the selection of control and cleaning points based on actual measurements.
Results Following Additional Bluelight Disinfection
After supplementing manual cleaning with automated blue-light disinfection, lower contamination levels were observed across all the sampling sites examined.
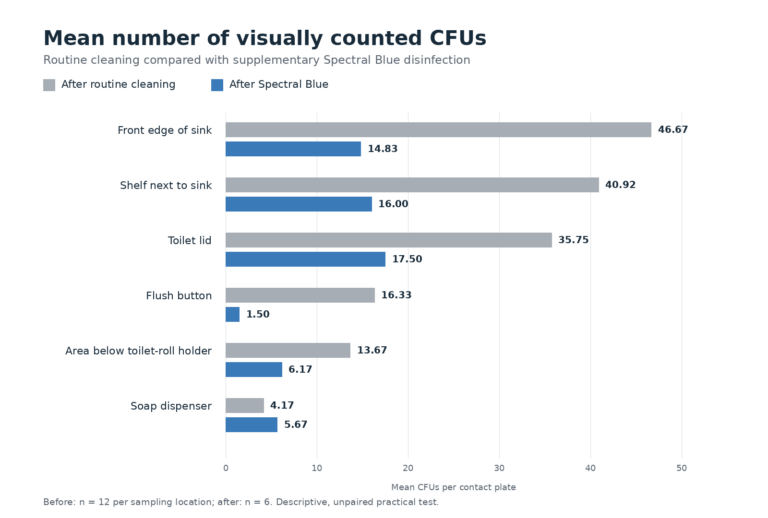
Average CFU per contact plate—at six sampling sites after regular cleaning and after additional blue-light disinfection. The values show a descriptive comparison of two measurement phases and do not constitute controlled proof of efficacy.
The mean KBE value per contact plate was 10.28 in the post-intervention phase, compared to 26.25 during the baseline assessment. This corresponds to a mean value that is 60.8% lower, based on descriptive statistics.
Lower average values were observed at five of the six sampling points examined. The difference was particularly noticeable at the flush handle and along the front edge of the sink.
The qualitative assessment also changed:
- Before the additional blue-light disinfection, ten of 72 samples were classified as “needing improvement” or “insufficient hygiene.”
- After the additional treatment, none of the 36 samples fell into either of these two categories.
- 21 of the 36 post-treatment samples were rated as “well cleaned.”
No comparable decrease in the mean value was observed at the soap dispenser. Sampling there was more difficult than at the other locations due to the very small surface area of the push button. This result also underscores how important it is to standardize sampling as much as possible when evaluating hygiene data.
What conclusions can be drawn from the field test?
The test provides two important practical insights.
Hygiene Plan
A hygiene plan should not focus exclusively on surfaces that are considered critical based on experience or intuition. Shelves and areas around the sink may also show noticeable contamination. Regular inspections help identify actual cleaning needs and make targeted adjustments to existing procedures.
Additional Benefits of Spectral Blue
The observed differences suggest that automated blue-light disinfection offers added value. It can complement manual cleaning and provide an additional, reproducible disinfection step.
However, this technology does not replace basic cleaning. Organic residues and visible impurities must still be removed mechanically. Automated disinfection should therefore be viewed as a complementary component of a comprehensive hygiene plan.
Conclusion
The field test shows that visible cleanliness and the actual distribution of microbial contamination do not always correspond. Abnormal readings were also detected on surfaces that may receive less attention compared to the toilet area.
After supplementing the regular cleaning routine with Spectral Blue, the measured contamination level was approximately 60% lower overall. The results thus provide practical evidence that automated blue-light disinfection can effectively complement existing hygiene measures.
The focus on a single bus restroom was part of the chosen test setup and allowed for a comparison within the same application environment. The results apply initially to this specific practical situation and should not be interpreted as universally valid scientific proof of efficacy.
At the same time, this was a practical test conducted in a single bus restroom and not a controlled scientific study. Differences in the number of samples, sample surfaces that were not always exactly identical, and varying activation times limit the comparability of the results. The results should therefore be understood as practical observations rather than as generally valid proof of effectiveness.
Device used in the test: Spectral Blue Oslo.
Spectral Blue provides continuous protection for your facilities—and it’s automated and consistently reproducible.